PHYSICAL RISK
Physical climate risks have been identified by financial regulators and insurance companies as a major financial risk to portfolios.
The Network for Greening the Financial System (NGFS), a global network consisting of 19 central banks and supervisors, argues for immediate action:
“Exact pathways may be uncertain, but it is foreseeable that financial risks will crystallize in some form through either the physical or transition channel, or some combination of them both. And while the financial risks may be realized in full over extended time horizon, the risks call for action in the short term to reduce impact in the long-term.”
Scenario analysis regarding physical climate risks also constitutes one of the core recommendations of the Financial Stability Board Task Force on Climate-related Financial Disclosres (TCFD).
Physical risks can impact companies’ cash flows and by extension the prices of financial securities and value of financial portfolios through three channels:
Direct effects are those effects by which physical risks directly impact the operational and / or production capacity of a company. Direct effects are usually measured at the point of production (e.g., power plant, factory, steel plant, etc.). However, they could also arise if the headquarters of a company are impacted, thus inhibiting a company’s ability to manage and control remote production processes.
Market effects are indirect effects by which a company’s markets are impacted by direct physical risks, thus inhibiting the company’s ability to sell into these markets. Market effects may arise as a result of damages to transport infrastructure inhibiting supply (e.g., damages to ports, electricity transmission lines, etc.) or consumers purchasing power inhibiting demand (e.g., a hurricane damaging coastal communities). Domino effects are knock-on effects from market effects or other factors that inhibit cash flows. These could lead to a diversion of resources to damaged communities that were originally earmarked for purposes benefitting the company. They could also lead to economic knock-on effects where a collapse in demand in one market impacts a second market that the company has significant exposure to. In that vein, transition risks can be considered ‘domino effects’ as climate policy accelerates in response to extreme weather events.
Each of these risks can impact cash flows in one of two ways. First, physical risks can create one-off impacts after which productive capacities and markets recover. These types of risks can manifest themselves through losses in cash flows in the short-term as well as through ‘recovery costs’ and additional adaptation costs. Second, physical risks can give rise to permanent impacts on cash flows with no recovery or adaptation costs, but more long-term impacts in terms of lost cash flows. Given the relatively nascent nature of physical climate risk modeling, the scenario analysis in this report will be limited to an ‘exposure’ perspective based exclusively on direct effects.
Climate-related physical risks cut across a range of traditional natural disaster categories (EM-DAT 2016):
Climatological risks arise from hazards related to long-lived, meso- to macro-scale atmospheric processes ranging from intra-seasonal to multi-decadal climate variability. Notable examples are droughts and wildfires. Climatological risks – as the name suggests – are likely to increase significantly in the medium- to long-term under global warming.
Meteorological risks arise from hazards caused by short-lived, micro- to meso-scale extreme weather and atmospheric conditions that last from minutes to days (e.g., storms and hurricanes). These events are similarly likely to intensify over time, with some evidence that the frequency and severity of hurricanes is likely to accelerate as a result of global warming.
Hydrological risks arise from hazards caused by the occurrence, movement, and distribution of surface and subsurface freshwater and saltwater (e.g., floods). Sea level rise resulting from glacier melting has been noticeable over the past two decades and is likely to increase over time.
Geophysical risks arise from hazards originating from solid earth. This term is used interchangeably with the term geological hazard. Examples include earthquakes or tsunamis. There is some academic literature suggesting that the impacts of climate change increase seismic activity (see, e.g., Sauber and Ruppert 2008).
Biological risks arise from hazards caused by exposure to living organisms and the toxic substances (e.g., venom and mold) or vector-borne diseases that they may carry. Changes in climate are likely to reduce biodiversity, which may be critical for agricultural activities for instance.
Water Scarcity Results
The figures below show the percent exposure to water scarcity of thermal power plants in the fixed income and listed equity portfolios, based on the WRI Aqueduct risk map in 2020 and 2040.
Water stress as a physical risk is a particular challenge for thermal power plants, which are labelled here as coal, oil, nuclear, and gas power plants (note: technically, solar thermal and geothermal power plants also fall in this category, though they operate differently relative to water stress). Water stress refers to the likelihood of water shortages in comparison to the current availability. This is only relevant for thermal power plants that by design require water for operations such as cooling or steam generation. The charts show, for each asset class, the current asset base exposure to water stress in 2020 and 2040, as well as the distribution of that exposure across individual companies in the relevant portfolios in 2020.
Risk levels are defined in four categories:

Aggregated Equity Portfolio
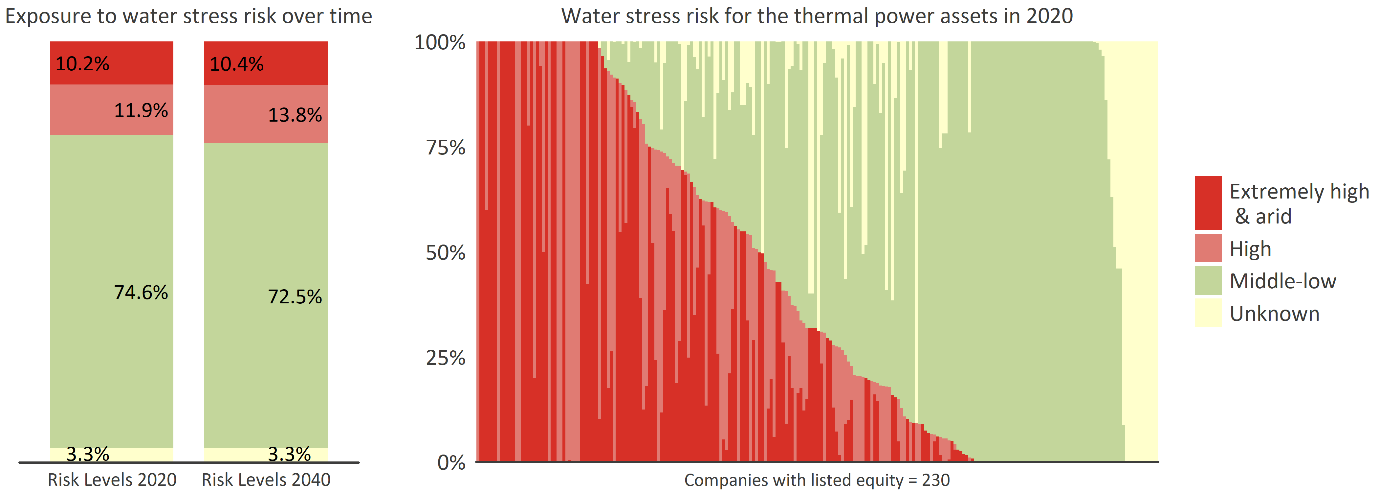
The above left figure shows the percentage of the coal, gas, oil and nuclear power plants within the aggregated equity portfolio exposed to the categories of water stress risk in 2020 and 2040. The above right figure shows the distribution of exposure of the coal, gas, oil and nuclear power plants within each company in the listed equity portfolio to each category of water stress risk in 2020. 10.2% of coal, gas, oil and nuclear power plants within the aggregated listed debt portfolio will be exposed to extremely high and arid water stress conditions by 2020.
Aggregated Debt Portfolio
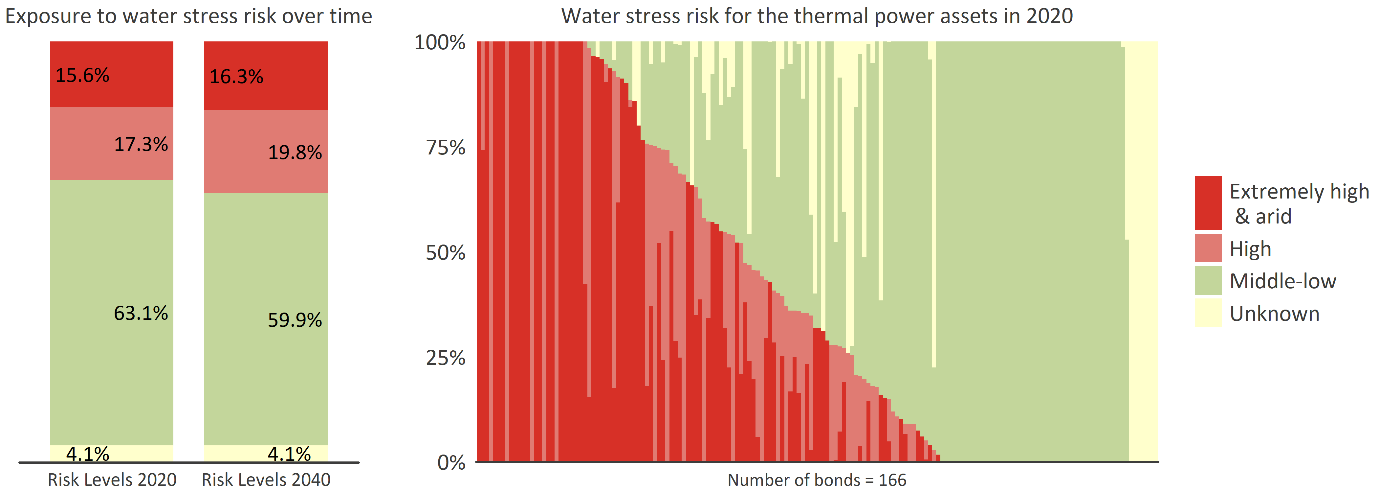
The above left figure shows the percentage of the coal, gas, oil and nuclear power plants within the aggregated debt portfolio exposed to the categories of water stress risk in 2020 and 2040. The above right figure shows the distribution of exposure of the coal, gas, oil and nuclear power plants within each company in the listed debt portfolio to each category of water stress risk in 2020. 15.6% of coal, gas, oil and nuclear power plants within the aggregated listed debt portfolio will be exposed to extremely high and arid water stress conditions by 2020.
Flood and Wildfire
The analytics below summarize the exposure of the portfolios’ power assets, oil and gas assets, and coal mining assets to flood and wildfire risk.
The flood risk analytics build on an EU-developed global flood risk map that classifies flood risk as 1 in 10, 1 in 20, 1 in 100, 1 in 200, or 1 in 500. The analysis here uses the 1 in 100 scenario, assuming an increased likelihood of flood events as global temperature rises.
The actual degree of ‘flood risk’ is a function of the specific nature of the asset and its position. Thus, a 2-meter flood may be material for some types of assets and not for others. As a result, the actual risk classification – being generic – may not be reflective of the actual underlying risk to any individual asset. As such, the classification seeks merely to represent the exposure of the portfolios’ assets to various flood outcomes.
The wildfire risk analytics build on the UNEP global wildfire risk map. Similar to flooding, wildfire risk will not constitute an equal ‘threat’ to all types of assets, varying in prominence as a function of specific characteristics of the assets.
Risk levels are defined in three categories:

Aggregated Equity Portfolio
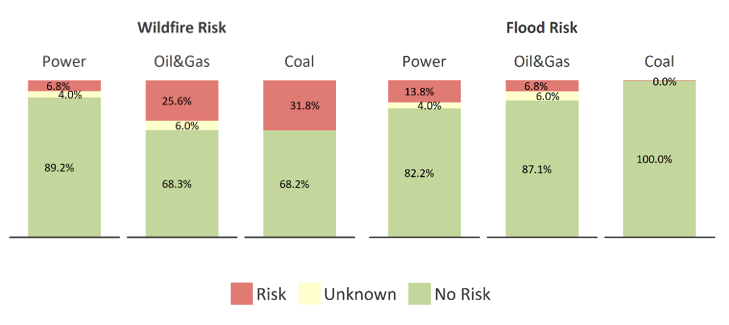
The above figures represent the percentage of the assets within each sector in the aggregated equity portfolio for California insurers with premiums over $100 million that are exposed to a risk of wildfires and flooding. 31.8% of coal mines and 25.6% of oil and gas production sites will be exposed to wildfire risk in 2020. 13.8% of power plants will be exposed to flooding risk in 2020.
Aggregated Debt Portfolio
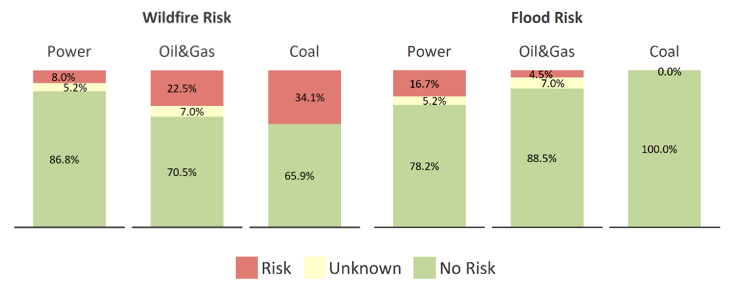
The above figures represent the percentage of the assets within each sector in the aggregated debt portfolio for California insurers with premiums over $100 million that are exposed to a risk of wildfires and flooding. 34.1% of coal mines and 22.5% of oil and gas production sites will be exposed to wildfire risk in 2020. 16.7% of power plants will be exposed to flooding risk in 2020.