TRAJECTORY FOR THE NEXT 5 YEARS
The trajectory is a measure of how much a portfolio’s technology exposure is changing over a given time horizon, which in this case is the next 5 years. For each technology, the ‘trajectory’ of a portfolio’s current production profile is constructed as an index of the yearly production or capacity allocated to the portfolio, with the start year (in this case 2018) equal to 100. This index is essentially the normalized growth rate of the production or capacity additions allocated to the portfolio over time. The gap between the trajectory of the portfolio’s currently planned output and the trajectory in a 1.75°C scenario is a measure of whether the portfolio is becoming more or less aligned with the scenario targets for a given technology over the time period, regardless of its initial level. For additional context, we also compare the portfolio’s currently known trajectory with the trajectories of a 2.7° and 3.2° scenario.
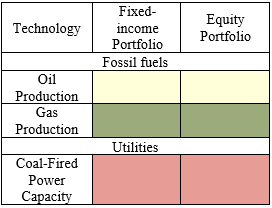
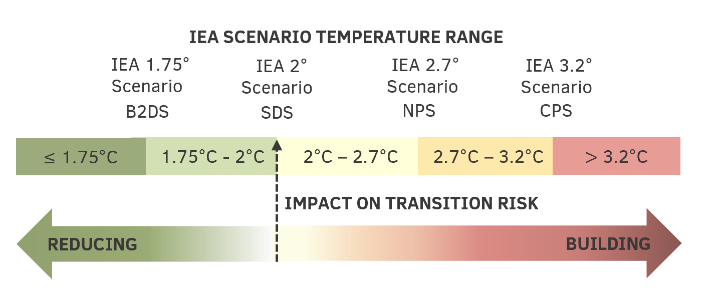
The results below show how the aggregated fixed-income and equity portfolios’ currently planned trajectories for three technologies - Oil Production, Gas Production, and Coal-fired Power Capacity - compare to their 1.75°C, 2°C, 2.7°C, and 3.2°C trajectories for those technologies. Results are color-coded in terms of temperature ranges bounded by the portfolio’s 1.75°C, 2°C, 2.7°C, and 3.2°C trajectories for each technology. The 1.75°C trajectory lines separates the darker and lighter green areas, the 2°C trajectory line separates the green and yellow area, the 2.7°C trajectory line separates the yellow and orange areas, and the 3.2°C trajectory line separates the orange and red areas (see legend below). A ‘green’ result is a trajectory in alignment with the 2° target - for this technology. Yellow, orange, and red results are considered to be “misaligned” with the trajectory of the 2° scenario, and therefore building exposure to transition risks over the time period.
Note that since trajectory does not consider the current (or initial) level of exposure to the technology (values are normalized to the start year 2018), these trajectory results are not indicative of a portfolio's projected exposure to a given technology; trajectory exposure simply assesses the path of exposure over the 5 year period, regardless of the starting point. For example, it is possible that a portfolio could be highly exposed to a risky technology in 2018 (current exposure), while at the same time the current production plans of companies held in that portfolio include aggressive decreases in production for that technology in line with the 2° scenario during the next 5 years. Both current exposure and the trajectory need to be considered for a full view of transition risk exposure. These results are available in the report sent/available to insurers.
Alignment of the aggregated fixed-income and equity portfolios’ known trajectories with the portfolios’ 1.75°C, 2°C, 2.7°C, and 3.2°C targets benchmarks, for selected technologies
Trajectory findings are summarized below:
Fossil Fuels. For both the aggregated fixed-income and equity portfolios, the currently known trajectory of Oil production through 2023 fluctuates in direction and between different targets. The oil production allocated to the fixed income portfolio increases over the coming year before decreasing by 2023 to be close to the 2°C target. The oil production allocated to the equity portfolio decreases before increasing again to be between the targets for 2°C and 2.7°C. The gas production allocated to both the listed equity and fixed income portfolios increases slightly before decreasing to remain within the targets corresponding to a 1.75°C temperature rise.
Utilities. For both the aggregated fixed-income and equity portfolios, the current coal-fired power installed capacity through 2023 is misaligned with the portfolios’ 1.75° target. For both portfolios the capacity shows a slight increase rather than a decrease as specified by the 2°C trajectory. To be aligned with the 1.75°C target, the overall capacity should decrease by 13% of the current capacity. The chart for the coal capacity does not present the announced retirements.
Comparison to the Markets. The aggregated fixed-income and equity portfolios for coal power capacity and oil production are more aligned with the 1.75°C target than the bond and stock market respectively. The exception is the fixed income portfolio for the gas production, however given that this technology allows an increase in production, and the results still fall within the range of the 1.75°C target this is not critical. This suggests that, in terms of trajectory, the investment choices made by insurers operating in California with over $100 million in annual premiums are more aligned with a 1.75°C transition pathways than financial markets.
TECHNOLOGY DEPLOYMENT TRAJECTORY: RESULTS FOR FOSSIL FUELS
The graphs below plot the currently known trajectories of the aggregated fixed-income and equity portfolios for three technologies-Oil Production, Gas Production, and Coal-fired Power Capacity additions-against a background defined by the trajectories of the 1.75°C, 2°C, 2.7°C, and 3.2°C scenarios for the same portfolios. The naming and temperature increase these correspond to by 2100 is presented here:
Beyond 2°C Scenario – B2DS – 1.75°C
Sustainable Development Scenario -SDS – 2°C
New Policies Scenario – NPS – 2.7°C
Current Policies Scenario – CPS -3.2°C
The solid lines on the graphs are the currently known trajectories of the aggregated fixed-income and equity portfolios for a given technology. As a comparison point, the dashed lines show the currently known trajectories of stock and bonds markets. The black line where the index equals 100 indicates no change over the time period, while the black arrow shows the direction and size of the change required for alignment with the trajectory of the 1.75° scenario in 2023. For the following graphs, the output data is plotted as a “unitless” index, however the underlying units for each technology are barrels of oil equivalent for Oil Production, cubic meters for Gas Production, and megawatts for Coal-fired Power Capacity additions.
Trajectory of Oil Production
Currently known trajectories compared with the IEA climate targets.
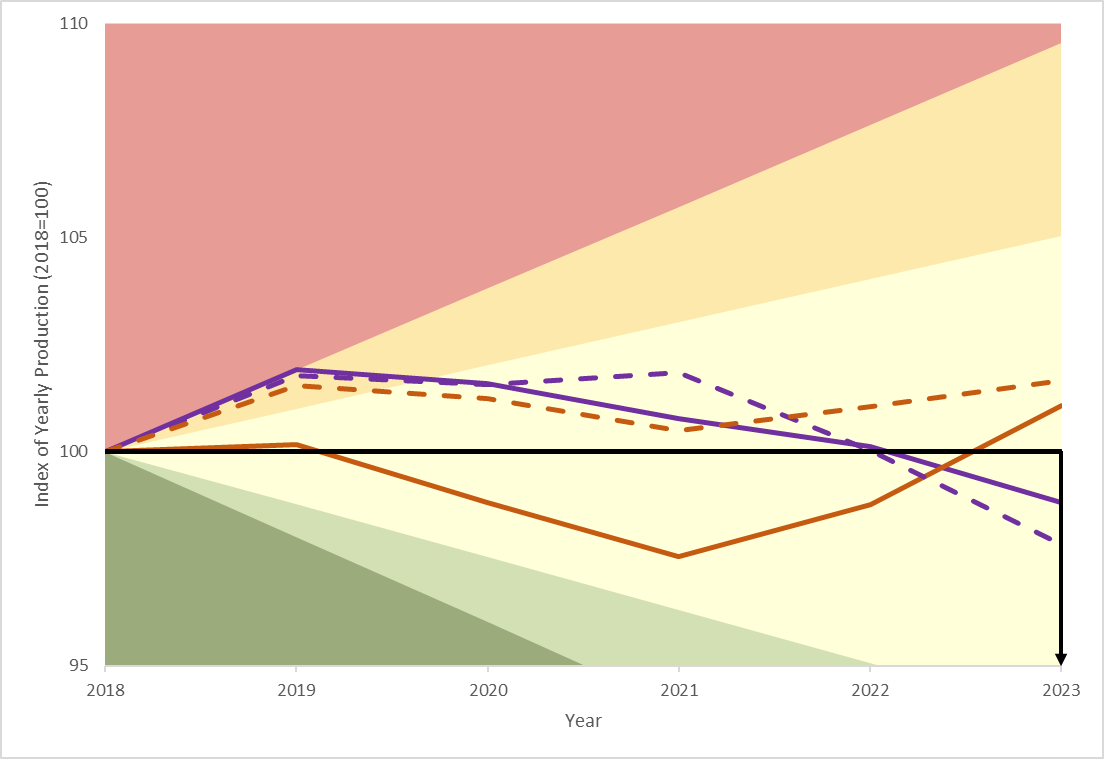

The graph above shows that the oil production trajectories of the aggregated fixed-income and equity portfolios of California insurers with over $100 million in premiums are aligned over the next five years between the IEA sustainable development and new policy scenario which reflects an expected temperature increase in the range of 2°C -2.7°C by 2100.
Trajectory of Gas Production
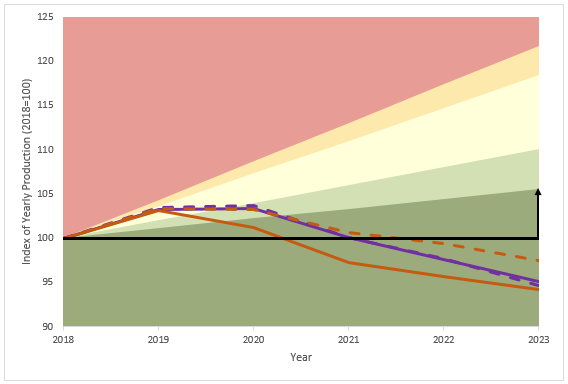

The graph above shows that the gas production trajectories of the aggregated fixed-income and equity portfolios of California insurers with over $100 million in premiums are aligned with the IEA beyond 2°C scenario, representative of a temperature increase of up to 1.75°C by 2100.
Trajectory of Coal-Fired Power Capacity
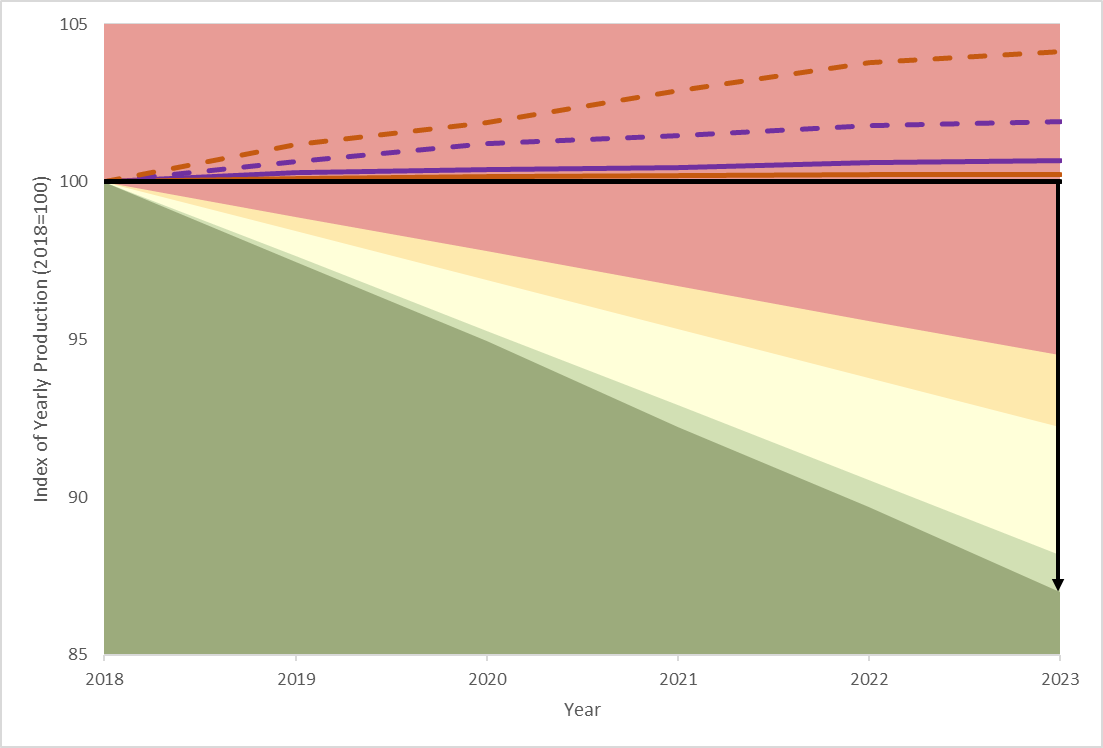

The graph above shows that the electric utilities of the aggregated fixed-income and equity portfolios of California insurers with over $100 million in premiums show a slight increase in coal fired power capacity which leaves the portfolios aligned with the IEA current policy scenario, representative of a temperature increase of more than 3.2°C by 2100.
Note that for simplicity the trajectory of the debt and equity portfolios for a given technology are plotted here on the same graph, against a background defined by the trajectories of the 1.75°C, 2°C, 2.7°C, and 3.2°C scenarios for the fixed-income portfolio. As the regional distribution of assets differ between the aggregated fixed-income and equity portfolios, their 1.75°C, 2°C, 2.7°C, and 3.2°C targets – and therefore background shading for these charts – technically differ as well. However, for the aggregated portfolios, the difference is slight and does not impact the overall alignment results, and so for simplicity of visualisation, both the equity and fixed income portfolios are shown here against a background defined for fixed-income.